


Too many guns are smoking
Is the smoking gun evidence sufficient to make a scientific claim?

I took a break from Substack, but I had a good excuse: I was finishing a manuscript that I am very excited about. The title is ‘Smoking gun’ signatures of topological milestones in trivial materials by measurement fine-tuning and data postselection, and you can already check it out on arXiv. I also had a chance to give a talk about this paper, so I decided to retell the talk in this post. The good thing is it has a lot of pictures.
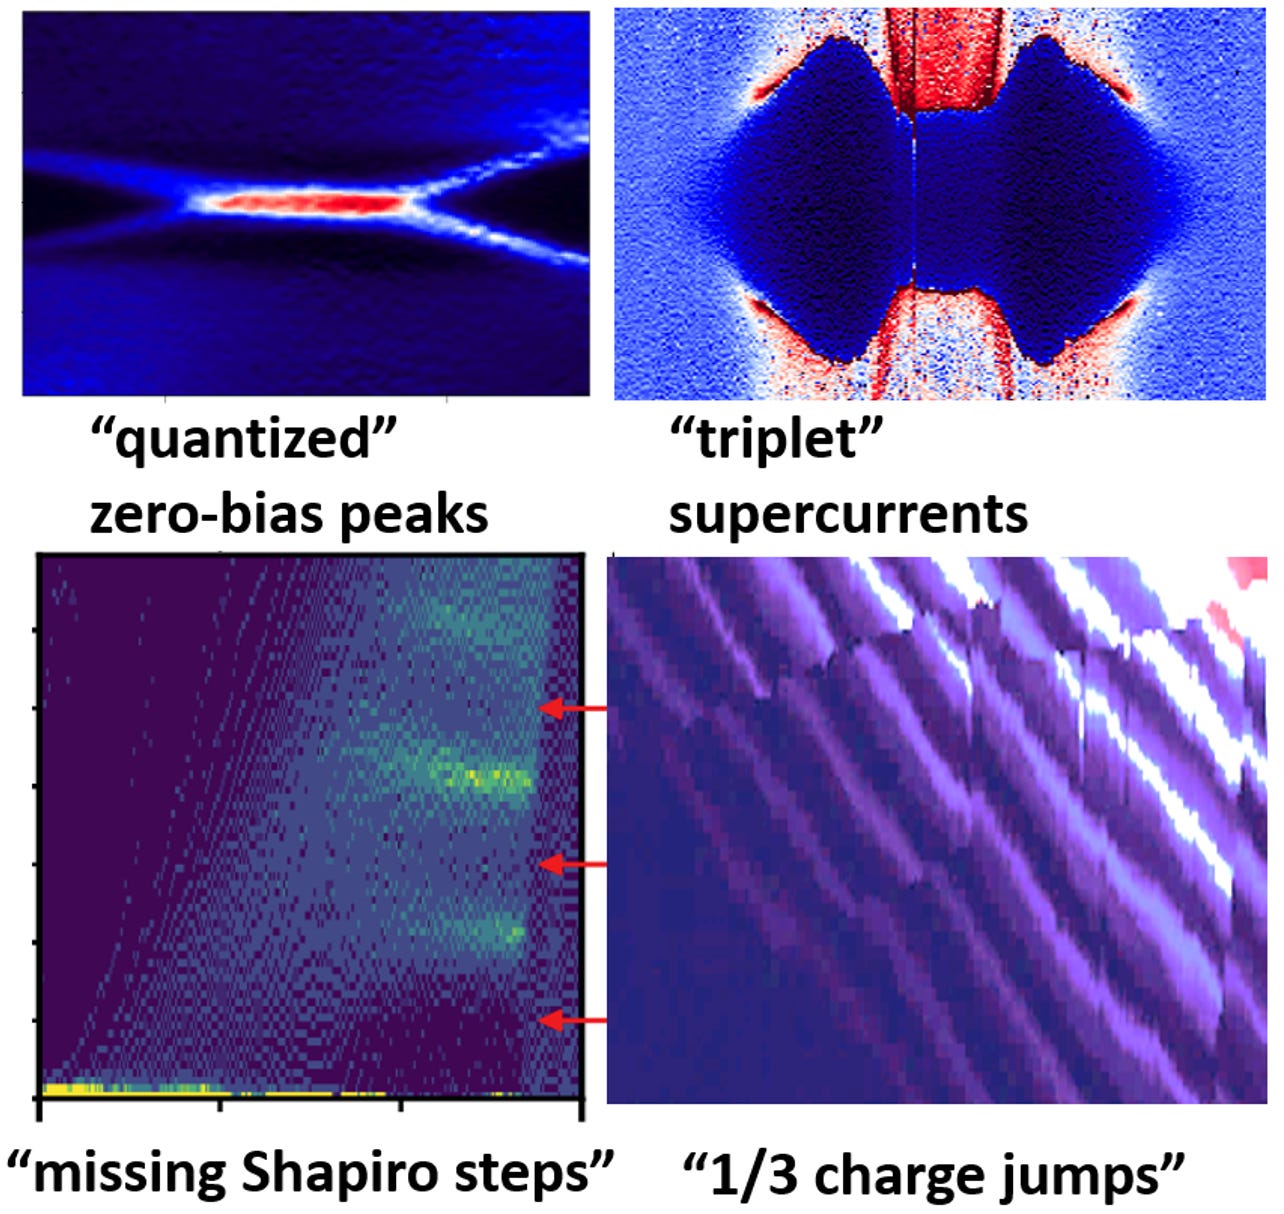
The paper goes over four examples where my students and postdocs (Po Zhang, Bomin Zhang, Yifan Jiang and Seth Byard) found very dramatic patterns in their data in four experiments. The images are so distinct that taken in isolation they can be used to convince a fairly informed physicist that a breakthrough was made in the field of exotic superconductivity or topological quantum computing. However, as the title already reveals, all four experiments are cases of finetuning and data selection.
First, let me give my definition of a “smoking gun” when it comes to making a scientific discovery. It is a piece of data, a graph, that contains the full proof of the phenomenon, a single figure that tells the entire story. True smoking gun discoveries have been made. My favorite is an experiment that was done in my previous lab in Urbana-Champaign, where I did my PhD, but five years before I arrived there. This is work by Dave Wollman and Dale Van Harlingen that is known as the “YBCO corner SQUID experiment”. I copy it here from their 1995 Phys. Rev. Lett. paper:
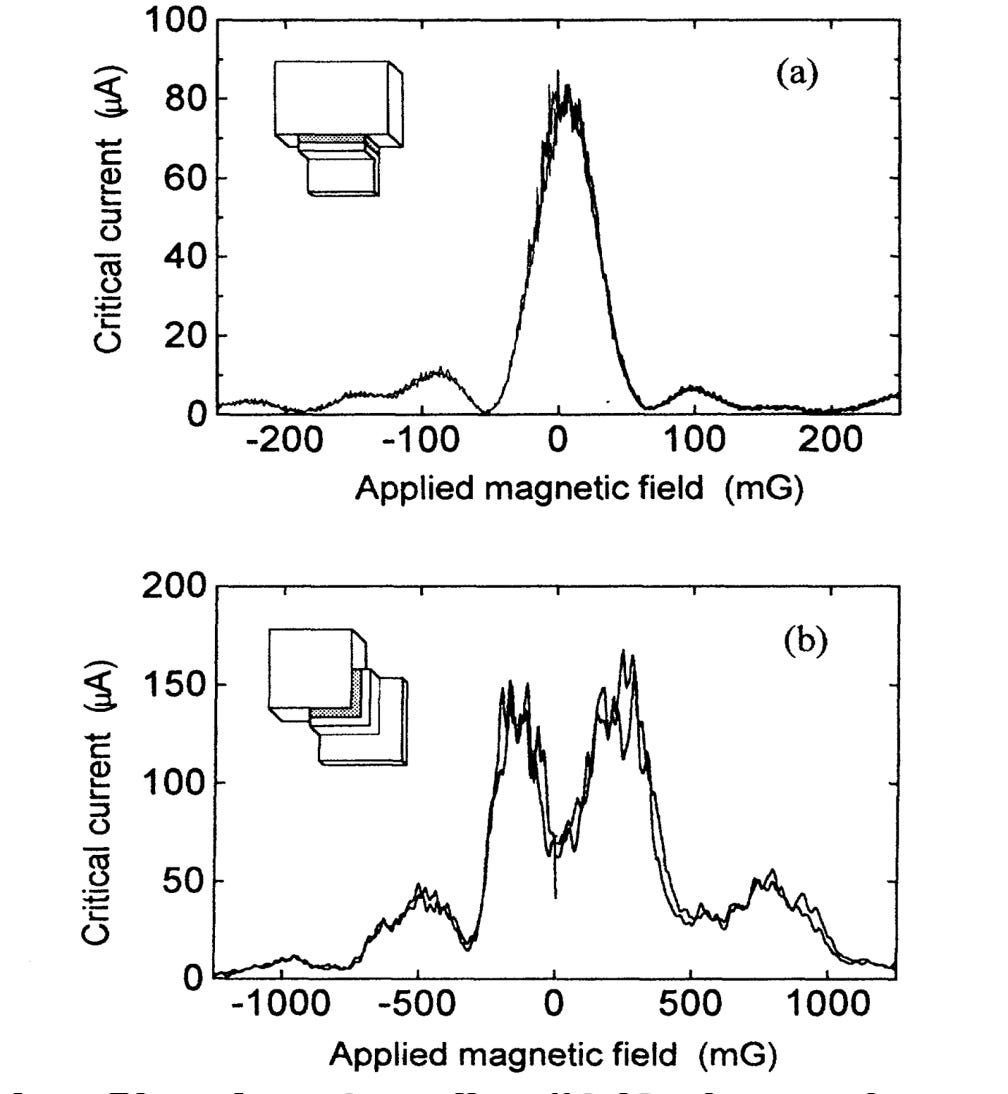
The actual smoking gun in these data is the dip at zero magnetic field in panel (b). The white cube is the YBCO crystal. When a contact is made around the corner of the crystal, the critical current diffraction pattern exhibits destructive interference (dip), proving that YBCO and other cuprate high temperature superconductors have d-wave pairing symmetry. The full importance of this work is not yet known, because the mechanism of high temperature superconductivity in cuprates is not completely established. But the effect is very dramatic: not only it is a smoking gun for d-wave, it is also a “yes/no” test for this property. If the pattern had a peak in the middle, that would be not d-wave, but s-wave, a more conventional pairing symmetry.
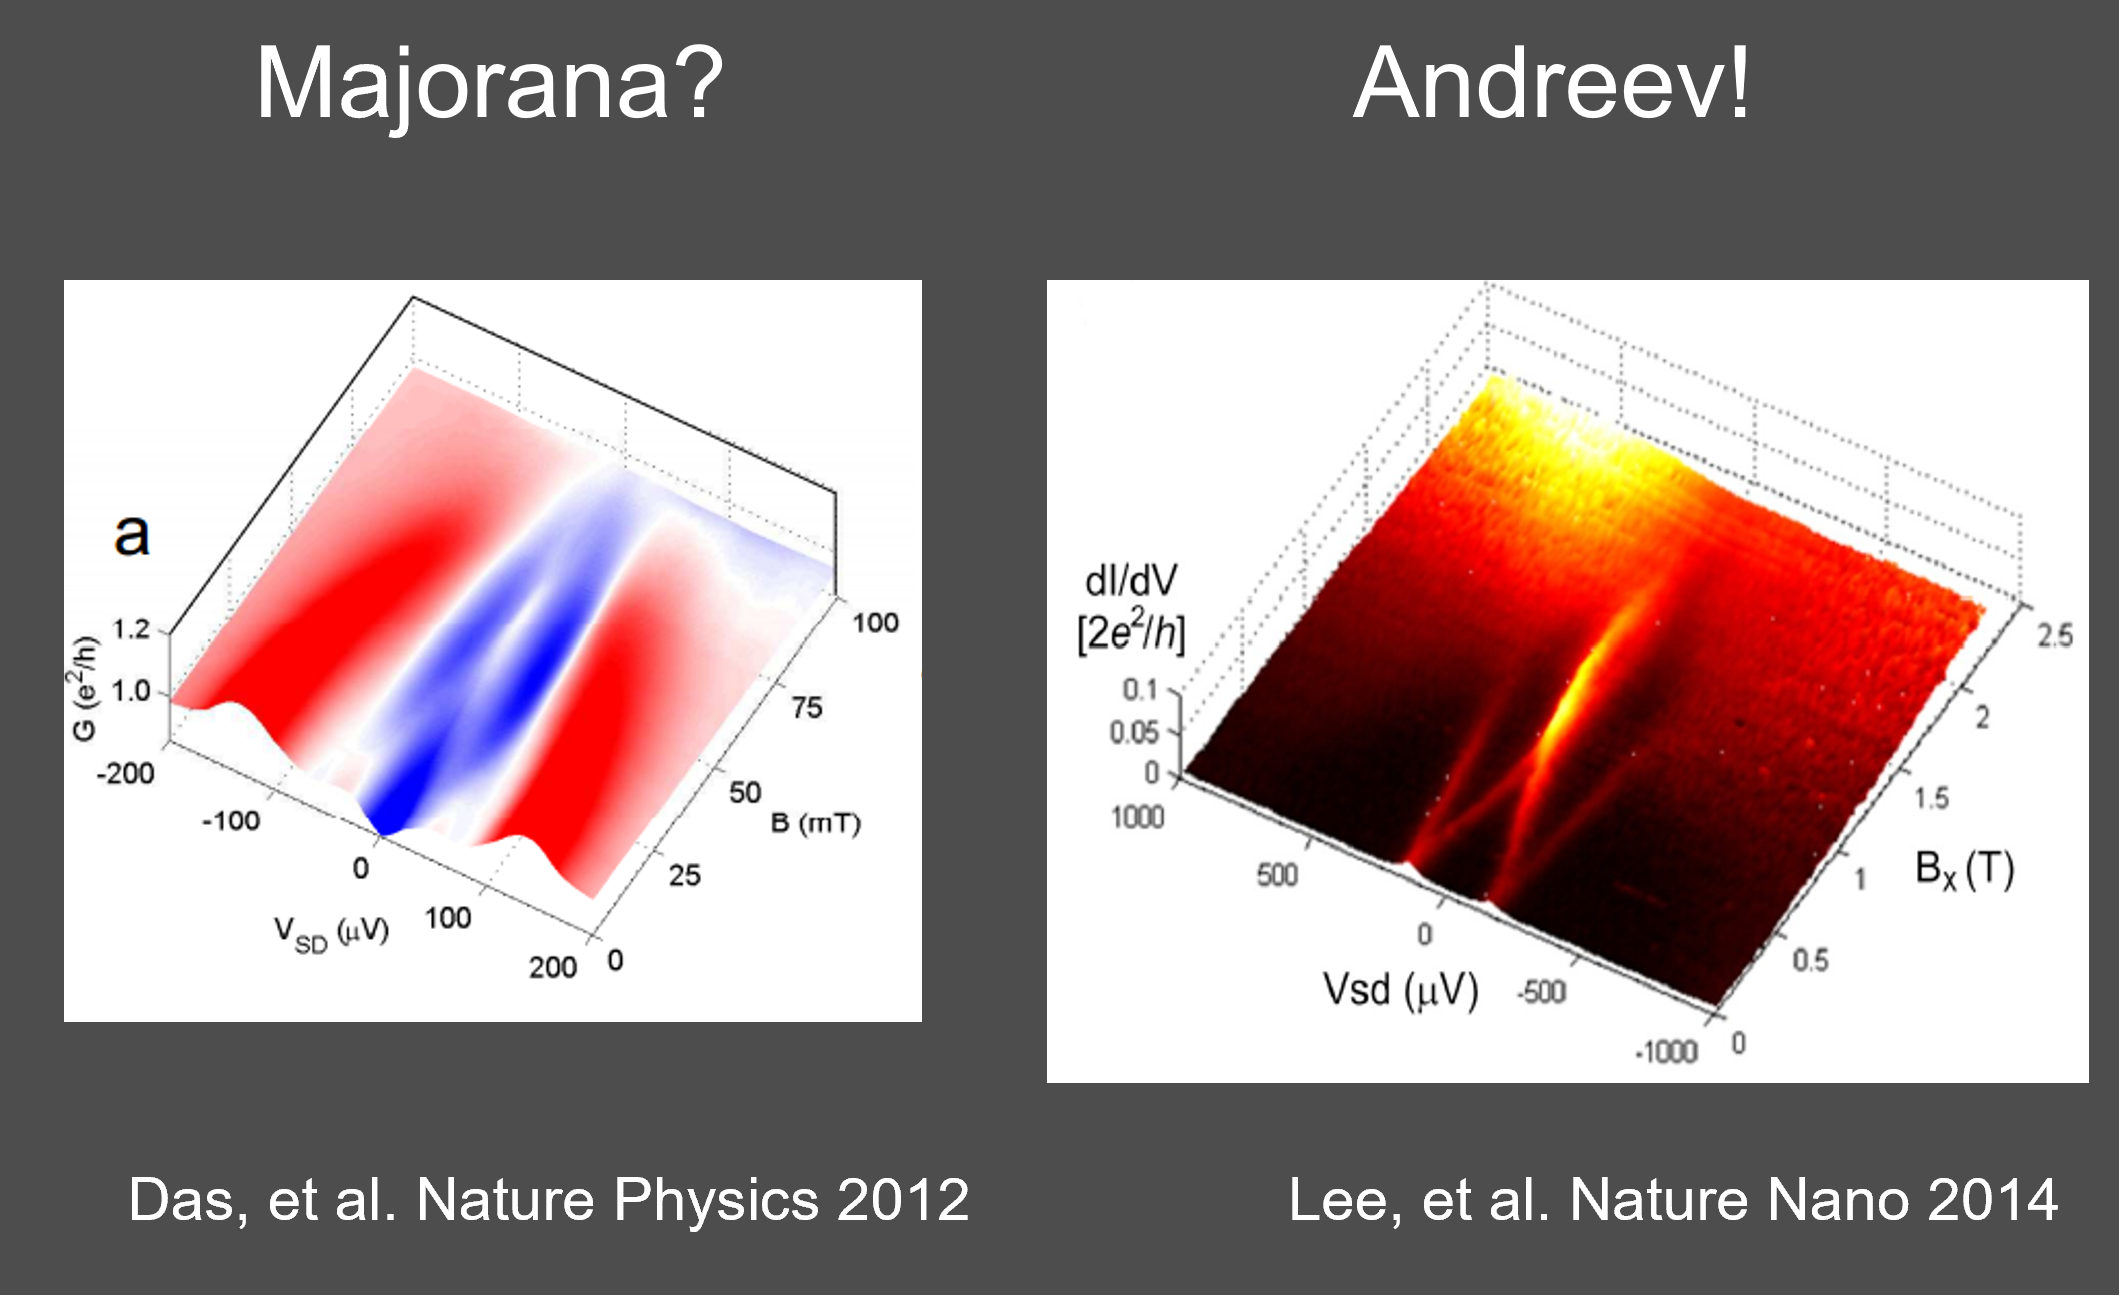
This is a very appealing way of doing science. While no story is every so simple, scoring a "smoking gun" is clearly a win. This is like a hole-in-one, or a touchdown, knocking one out of the park (or use your favorite sports analogy here). I too wanted to find my own smoking gun. I came close with the initial Majorana paper. I remember many people telling me and other authors: “you really got it!”, it felt good. Here is what I wrote about it at the time in 2012, I was rather upbeat. Of course the doubts lingered and the initial signatures did not turn out to be Majorana. But the signal we reported was also fairly dramatic and the figure was self-contained: the zero-bias peak that appeared at finite magnetic field in a nanowire-superconductor device, just like the theory predicted it:
Really, what else could it be? We did not know of any alternatives then.
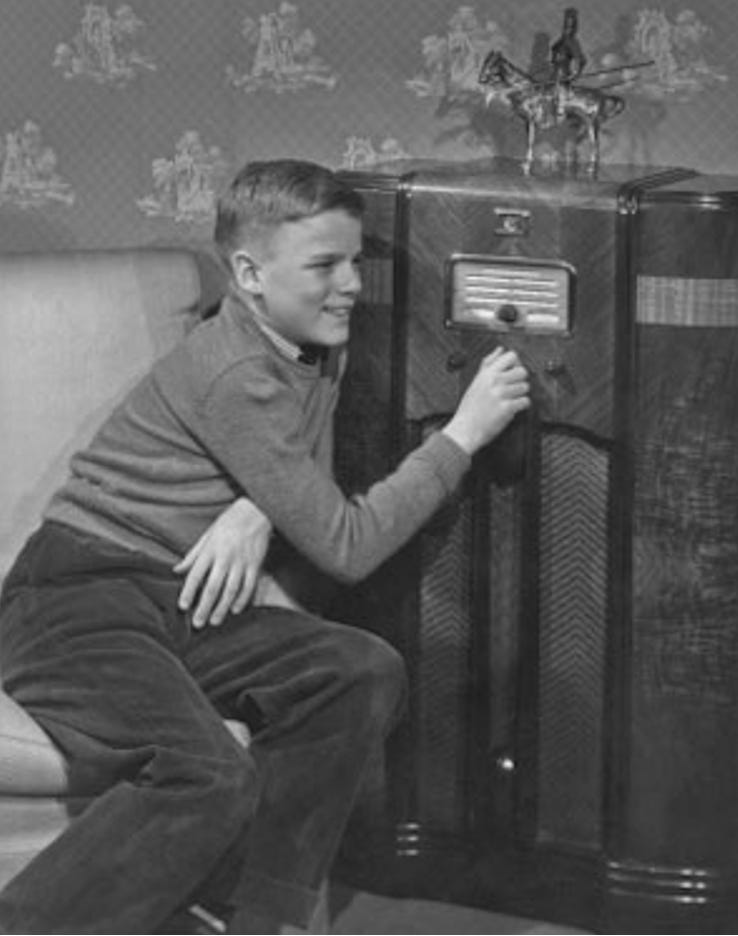
I should also discuss how we found this signal. More or less the way the child in the picture below is searching around for his favorite station on the old radio: we tuned around until it was there. We did not have any reference as to where we should be searching, the idea at the time was that if we see a pattern like this, and it passes a few secondary checks, it would be Majorana. In principle, the “looking around” approach is a valid method of discovery. Suppose you are trying to find signs of alien life. You don’t know which star you should focus on, so you survey the sky. It would also have to be rather fine-tuned.
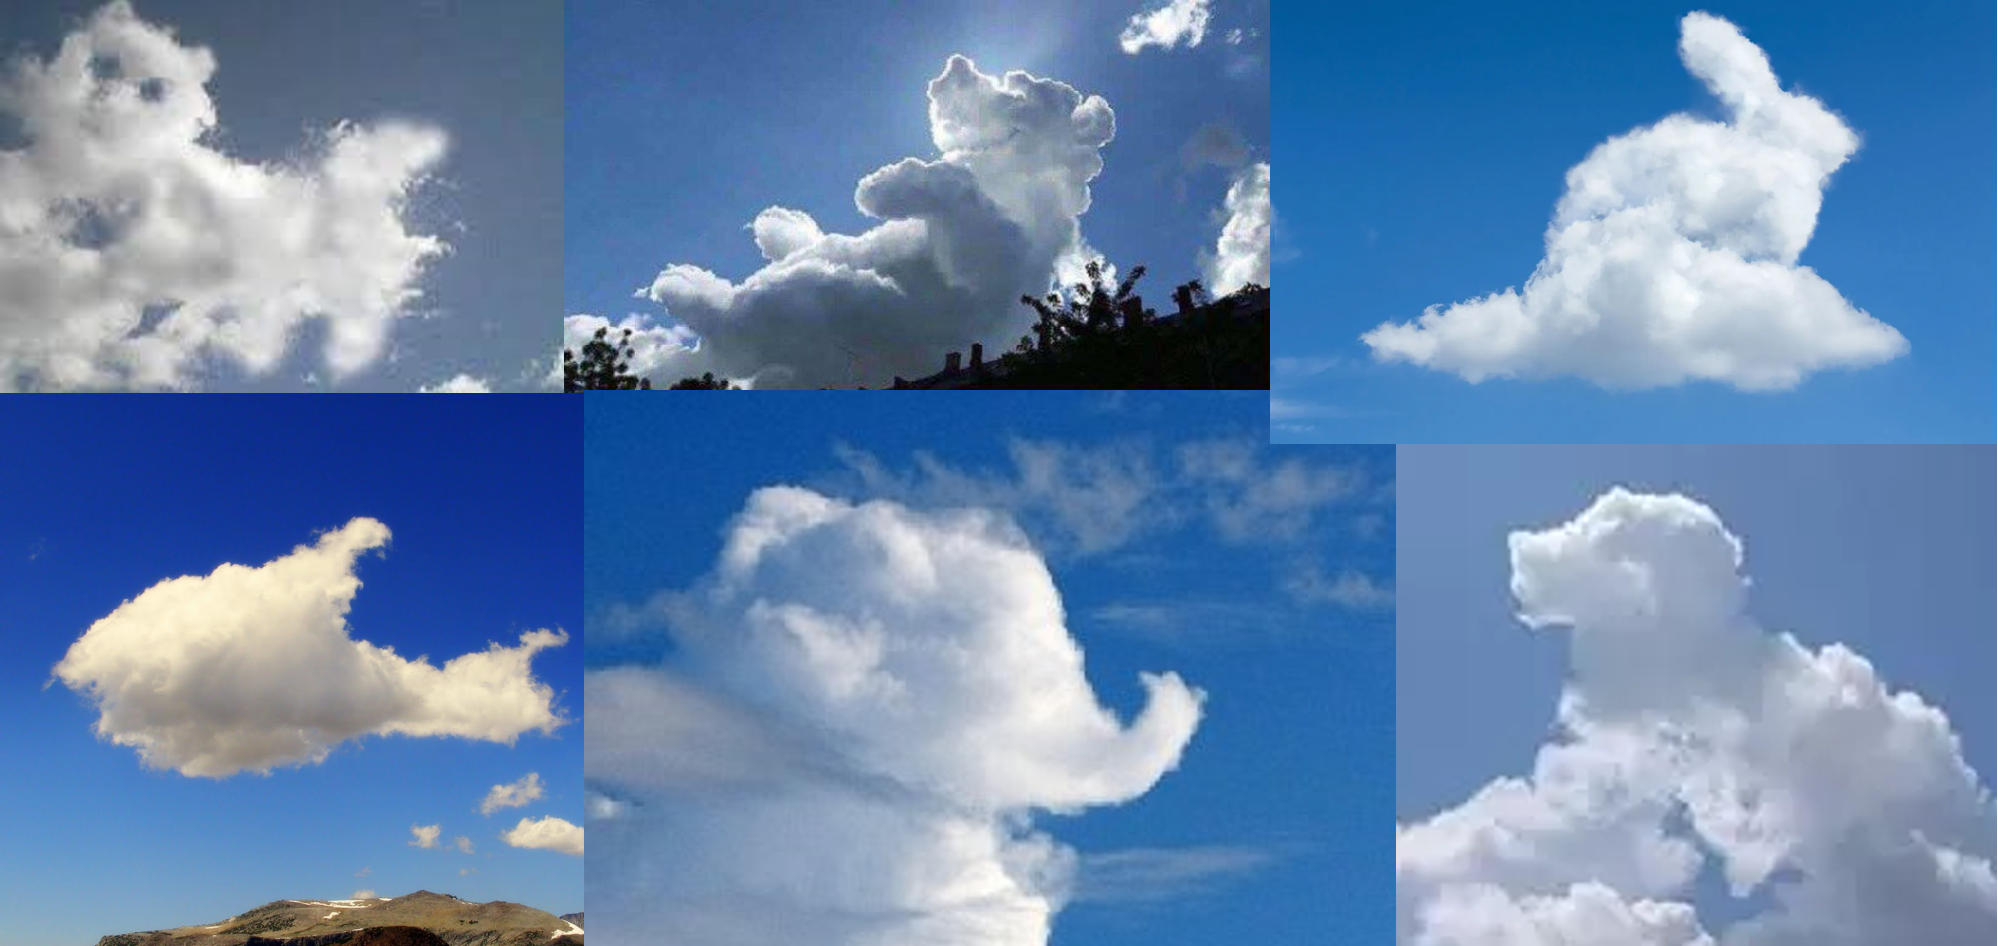
The challenge, however, is in how rich the patterns can be when the samples are very small. Physics has moved to smaller and smaller objects, such that we deal with individual electrons, spins or photons. What comes to the forefront is the fluctuations. Small changes in the environment can influence the data a lot. And quantum interferences are like waves on the water, they can generate amazing images. My current preferred analogy is to the clouds in the sky:
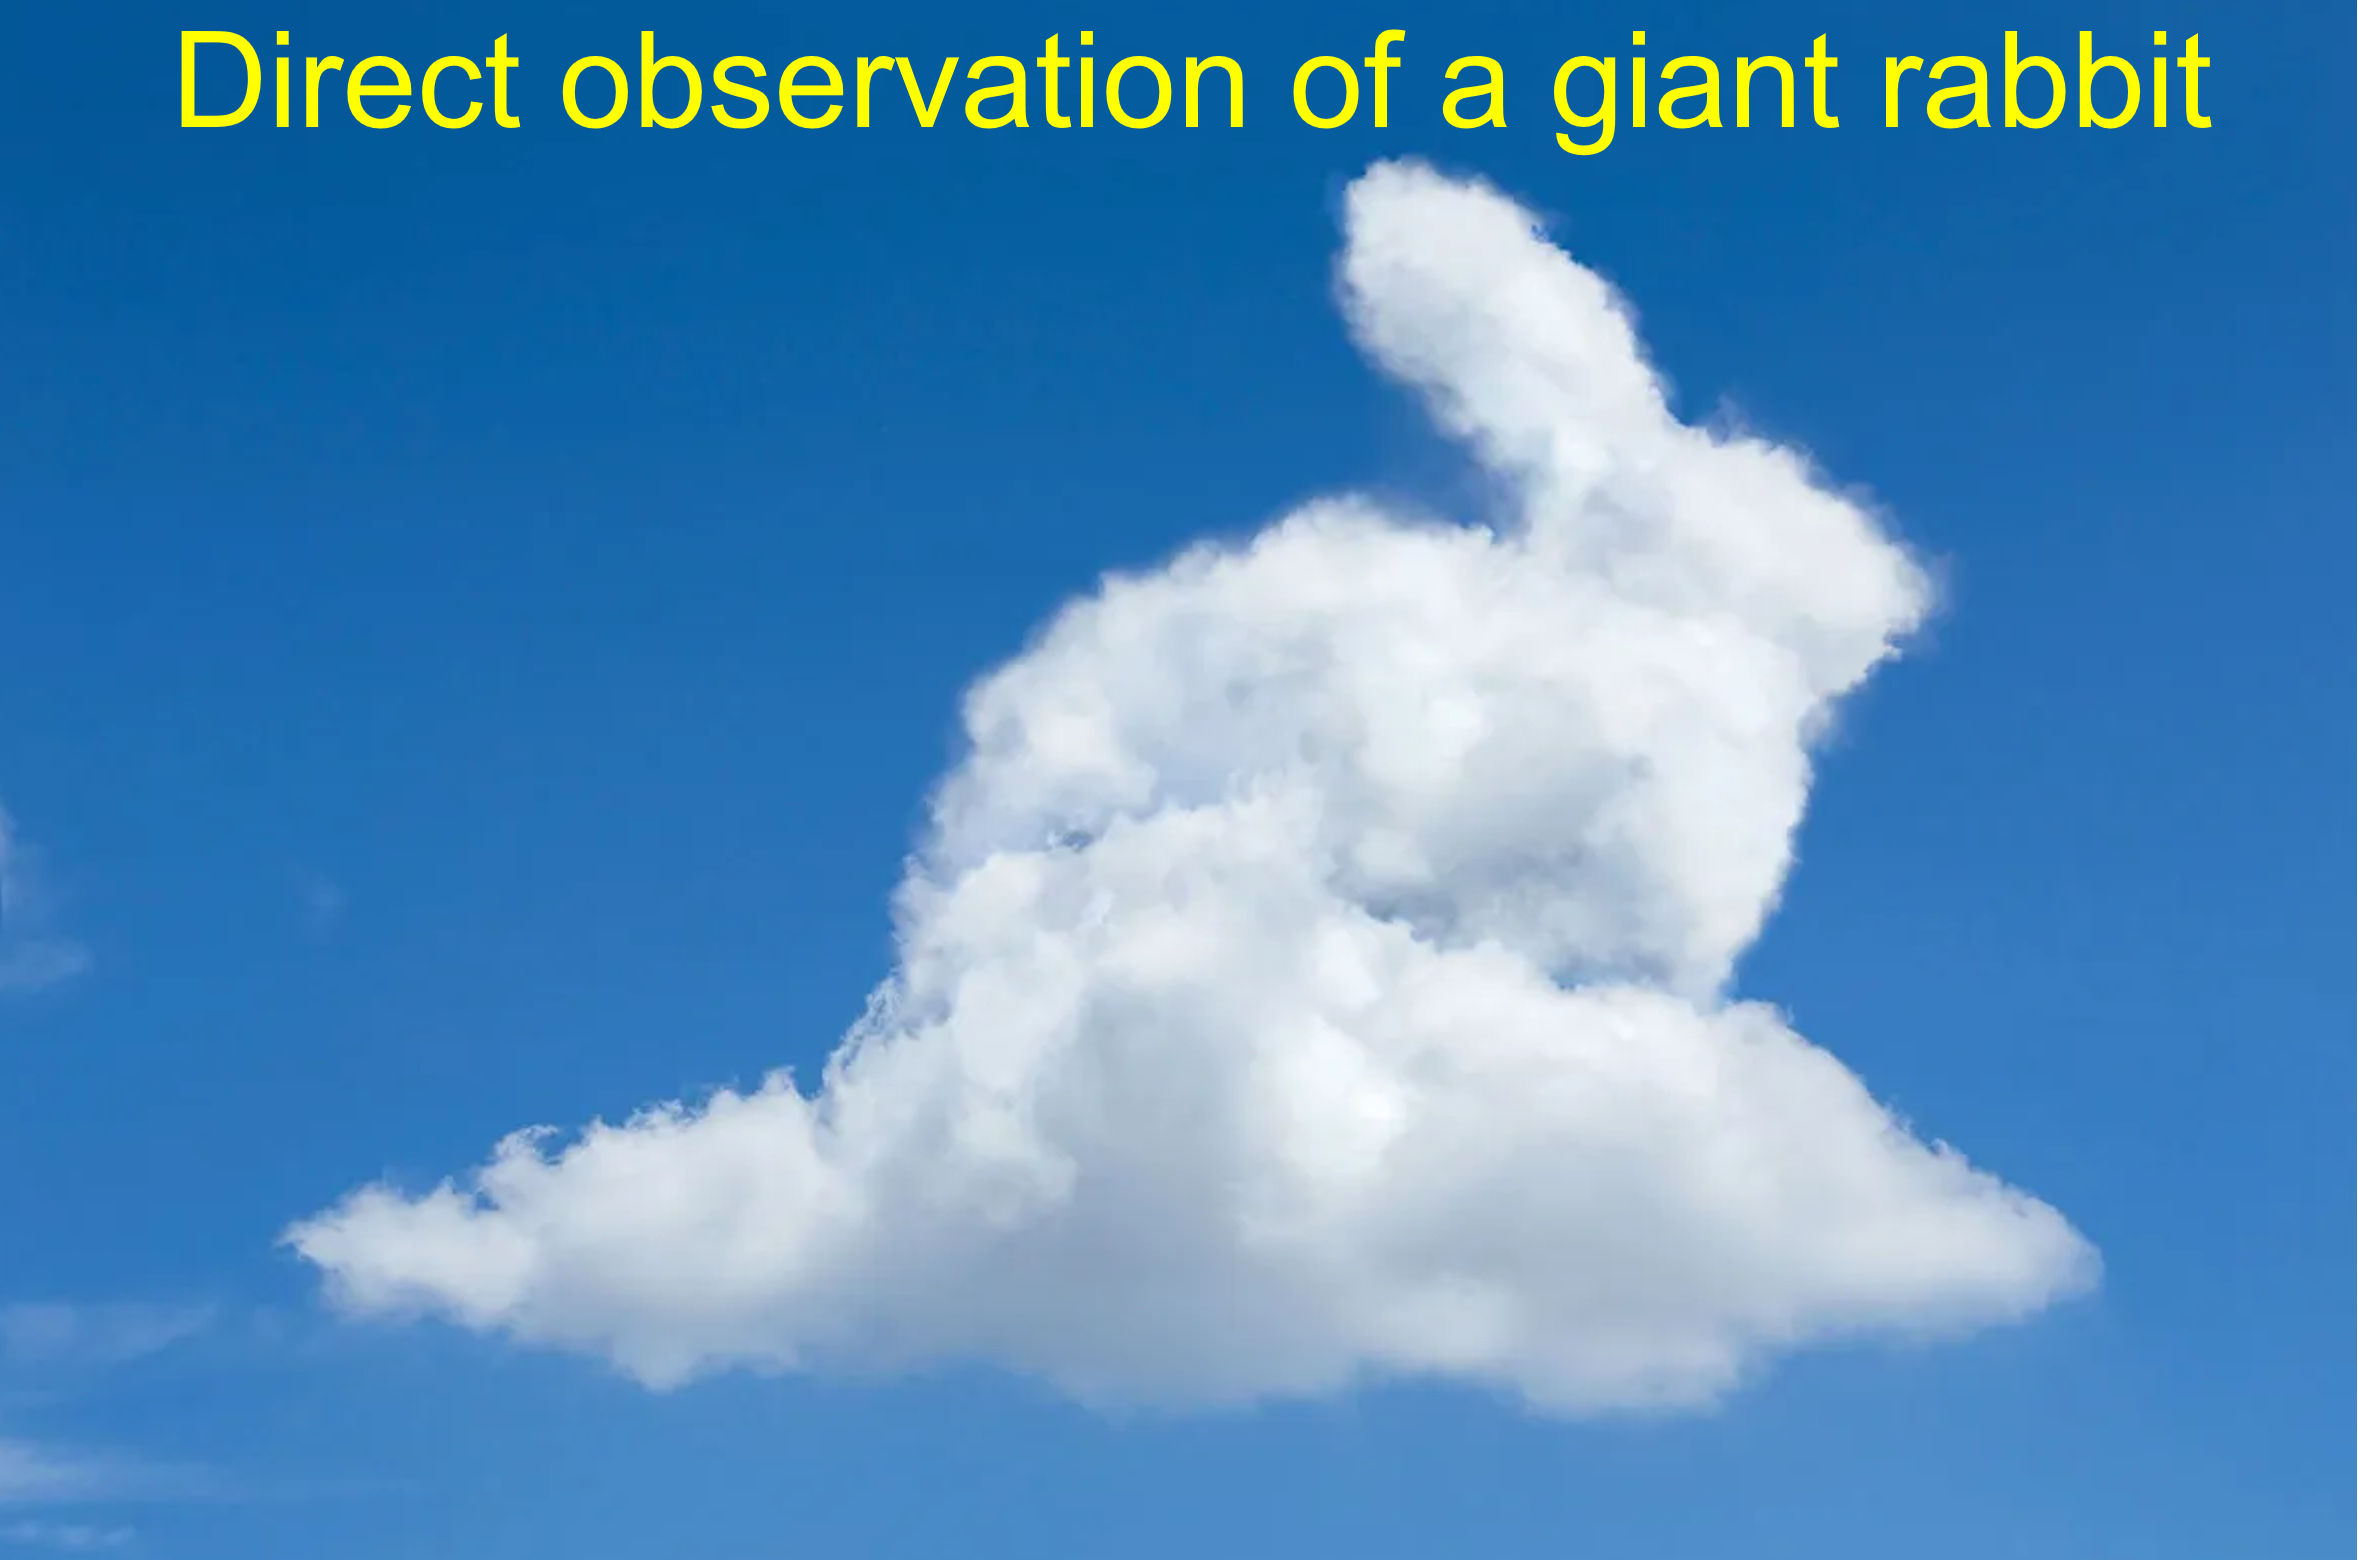
You can be looking up and seeing a very clear rabbit, but give it a moment and it begins to deform and split up until it no longer looks like anything. This is what the data in small (mesoscopic) samples is like. If you take several snapshots at the right moment, under the right conditions, you can make a claim that you have observed a zoo of huge animals floating in the air.
This is what happened with Majorana. A couple of years after our first paper, another group from Grenoble found a similar zero-bias peak signal, but under conditions incompatible with Majorana. They found another explanation for it, in terms of interesting but less exciting Andreev bound states in quantum dots.
It turns out that the smoking-gun-like data, that is in reality something entirely different, is not that rare. In our new paper we went through four of our experiments and gathered smoking gun look-alikes. Our point is to bring attention to how this method of making a scientific claim - through demonstrating a smoking gun - has a major blind spot when it comes to data selection. This is important because a typical scientific paper is just an illustrated essay: it only includes 3-5 figures, so data selection is present in the design of the modern peer-review publishing.
But let me give you a quick run through our examples, and you can read the paper for more details. For 3 of the 4 examples we also wrote in-depth standalone papers, I link to them below.
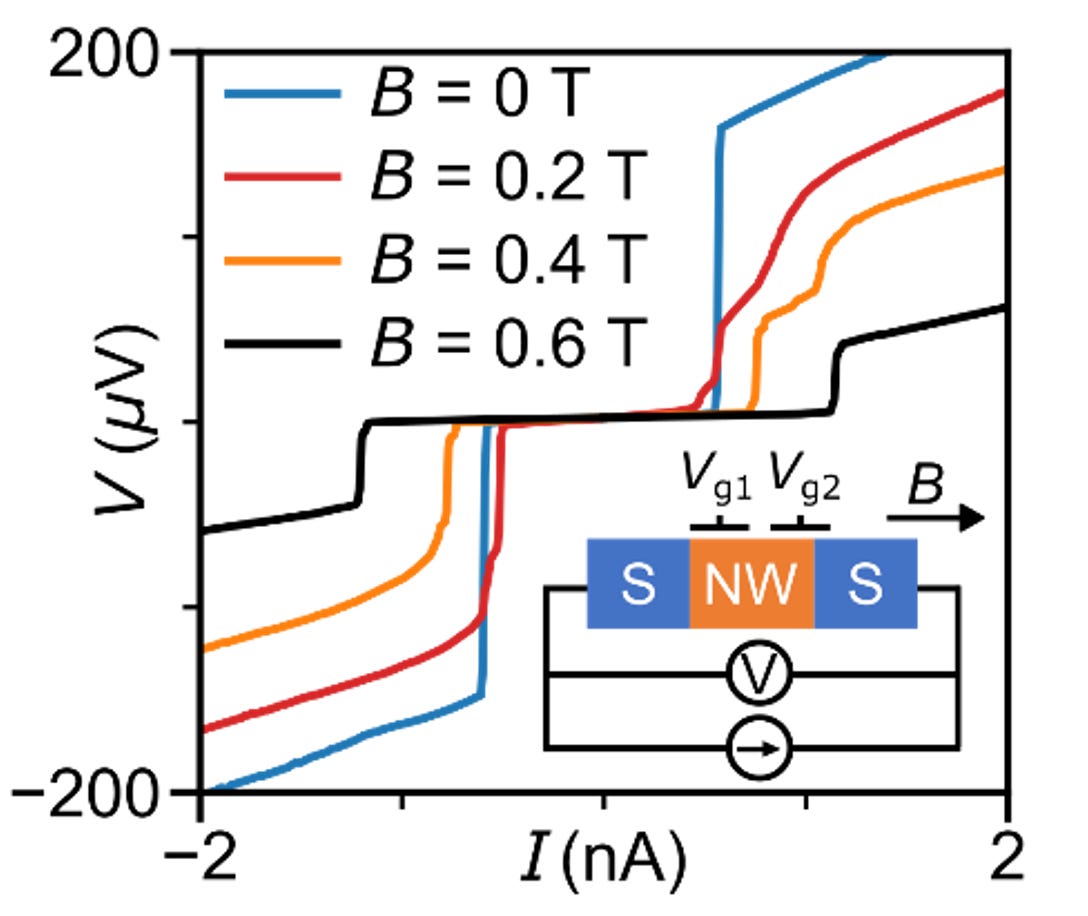
Our first example is superconductivity that strengthens with magnetic field. Superconductivity is the zero-voltage state, and you can see in the figure that for higher fields B (orange and black curves) the zero-voltage region expands around the horizontal axis. This is quite uncommon. Magnetic field is the enemy of superconductivity. Because pretty much all (s-wave, and even d-wave) superconductivity originates from anti-aligned electron spins, but magnetic field wants to flip all the spins in its own direction, and this destroys superconductivity.
The counterintuitive behavior can lead you to think that spins in this sample, which happens to be a nanowire coated with a standard superconductor, are already co-aligned at zero field, and therefore the field does not disturb them but only makes them even more aligned. This would be known as “triplet” superconductivity which is a highly coveted state of matter. However, the figure I pasted falls apart if we tune the control knobs - gates g1 and g2 - much like if we tuned the radio and lost the station. The increase in supercurrent is accidental and does not signify an exotic state of matter. These data are from the work of Bomin Zhang. He has a separate paper on these devices, but we did not go into the details of increasing supercurrents there.
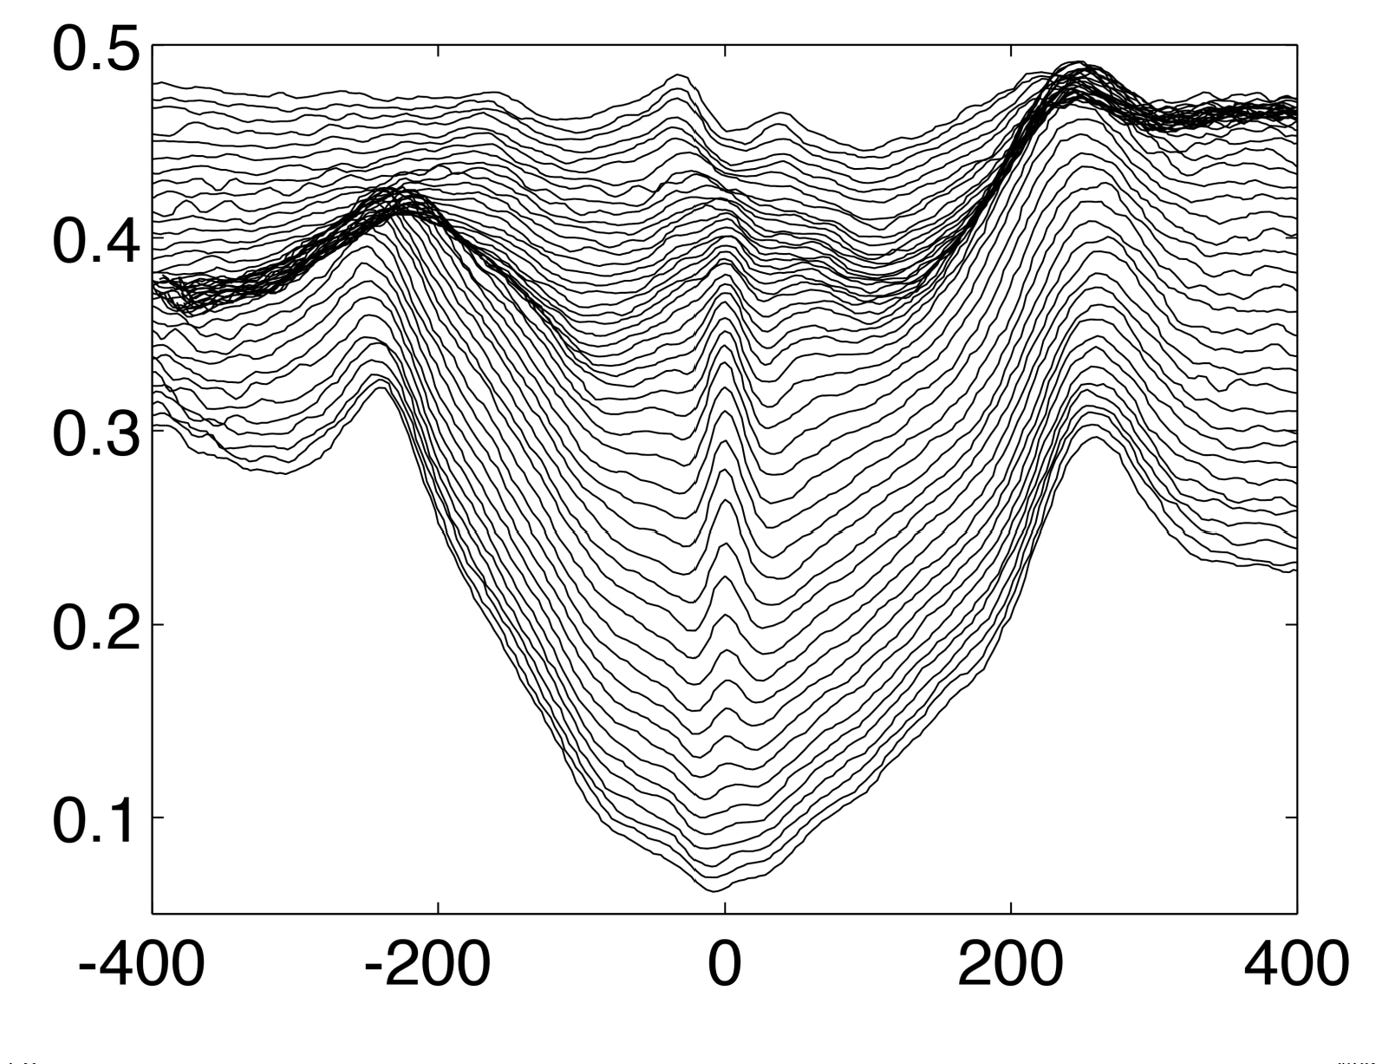
My second example is on the zero-bias peaks, which like I wrote already can mark the presence of Majorana modes. Here we find one such peak, which does a peculiar thing - as we vary the gate sg1 it does not change its height for a while. You can see in the linecut below how the top of the signal is kind of flat, if you ignore the fluctuations, it stays between the two “5%” dashes lines for a while.
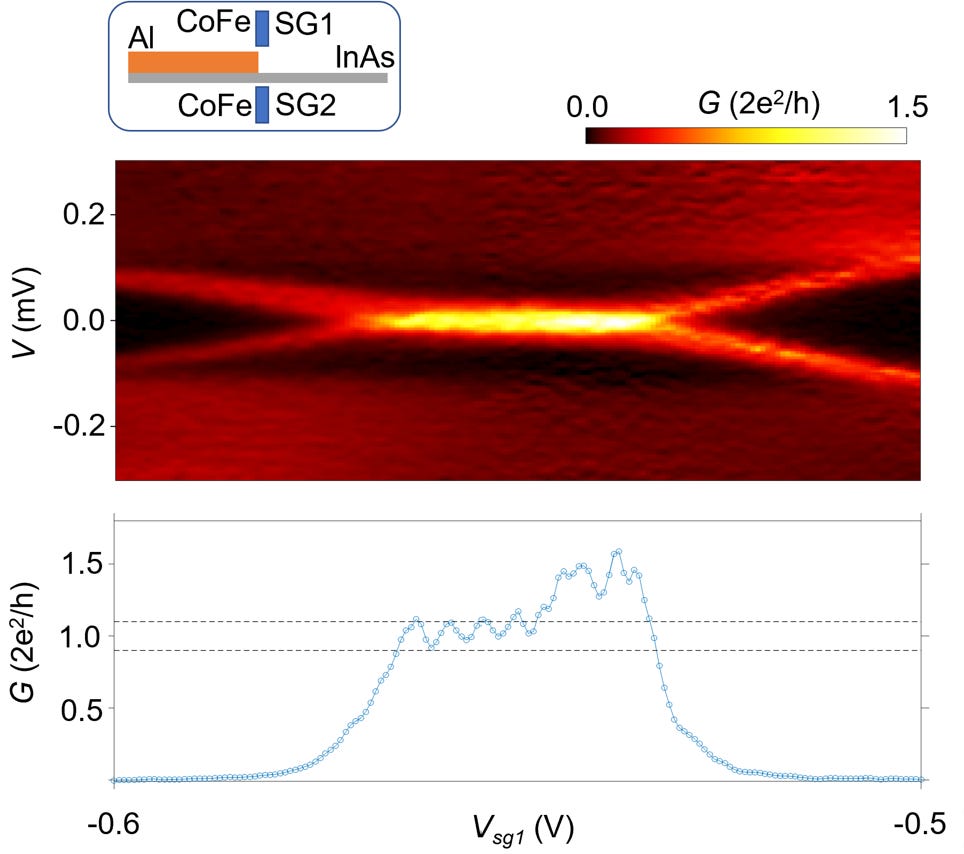
The idea that you find in a couple of papers out there, including one of the retracted Delft papers, and another one by the same key author but now from Tsinghua, is that regions of zero-bias peak that possess the kind of flatness, or ‘plateau’, are suggestive of Majorana. In our work, this plateau-like appearance is fairly easy to obtain through fine-tuning, and it goes away just as easily. Yifan Jiang, my former student who graduated this year, has a separate paper about these devices where we also discuss the pseudo plateaus.
The third example is about missing plateaus, or steps, in the signal. My former postdoc Po Zhang who now works in Beijing, was measuring a very important physics effect called “Shapiro steps” - in planar superconductor semiconductor junctions. Shapiro steps is what the voltage standard at NIST is based upon.
There is a prediction that in topological junctions, which contain Majorana modes, the voltages of Shapiro steps are doubled, which is the same as saying that every other step in the Shapiro staircase is gone. Well, we found exactly such missing odd-order Shapiro steps, marked by red arrows in panel (b). This got to be topological superconductivity, what else could it be?
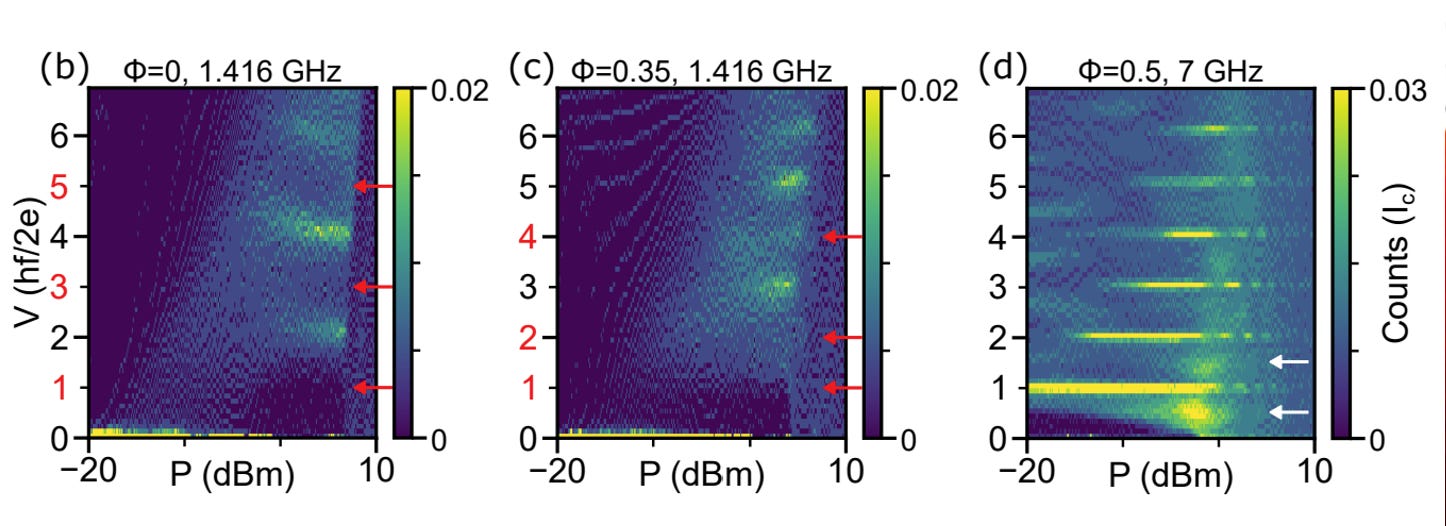
Although in panel (c) we show steps at even positions missing, and the predicted pattern falls apart. In panel (d) we find extra steps, at half-frequencies, in the same device. The differences are minor - a change in the applied magnetic flux, applied frequency. The wind blew, and the clouds shifted, the rabbit no longer looks like anything.
My final example is the work of Seth Byard, my current student, who was measuring periodic conductance oscillations, that you can see as blue and red parallel lines in the figure below. If you cross once of the periods, from bottom left to upper right, you are adding one electron to the island. So the period of the pattern is e, the electronic charge. The dramatic signal in these data is the abrupt shifts along the dashed yellow lines. The shifts are by a fraction of the period, and this makes you think that we have detected fractional charges. Now, all elementary particles, except quarks, have integer charges. But in condensed matter physics we know of quasiparticles of fractional charge, in the fractional quantum Hall regime. In fact, shift just like these were reported by the Purdue group as ‘Direct observation of anyonic braiding” which would be a stepping stone to the topological quantum computing, especially if you repeat the experiment with Majorana particles.
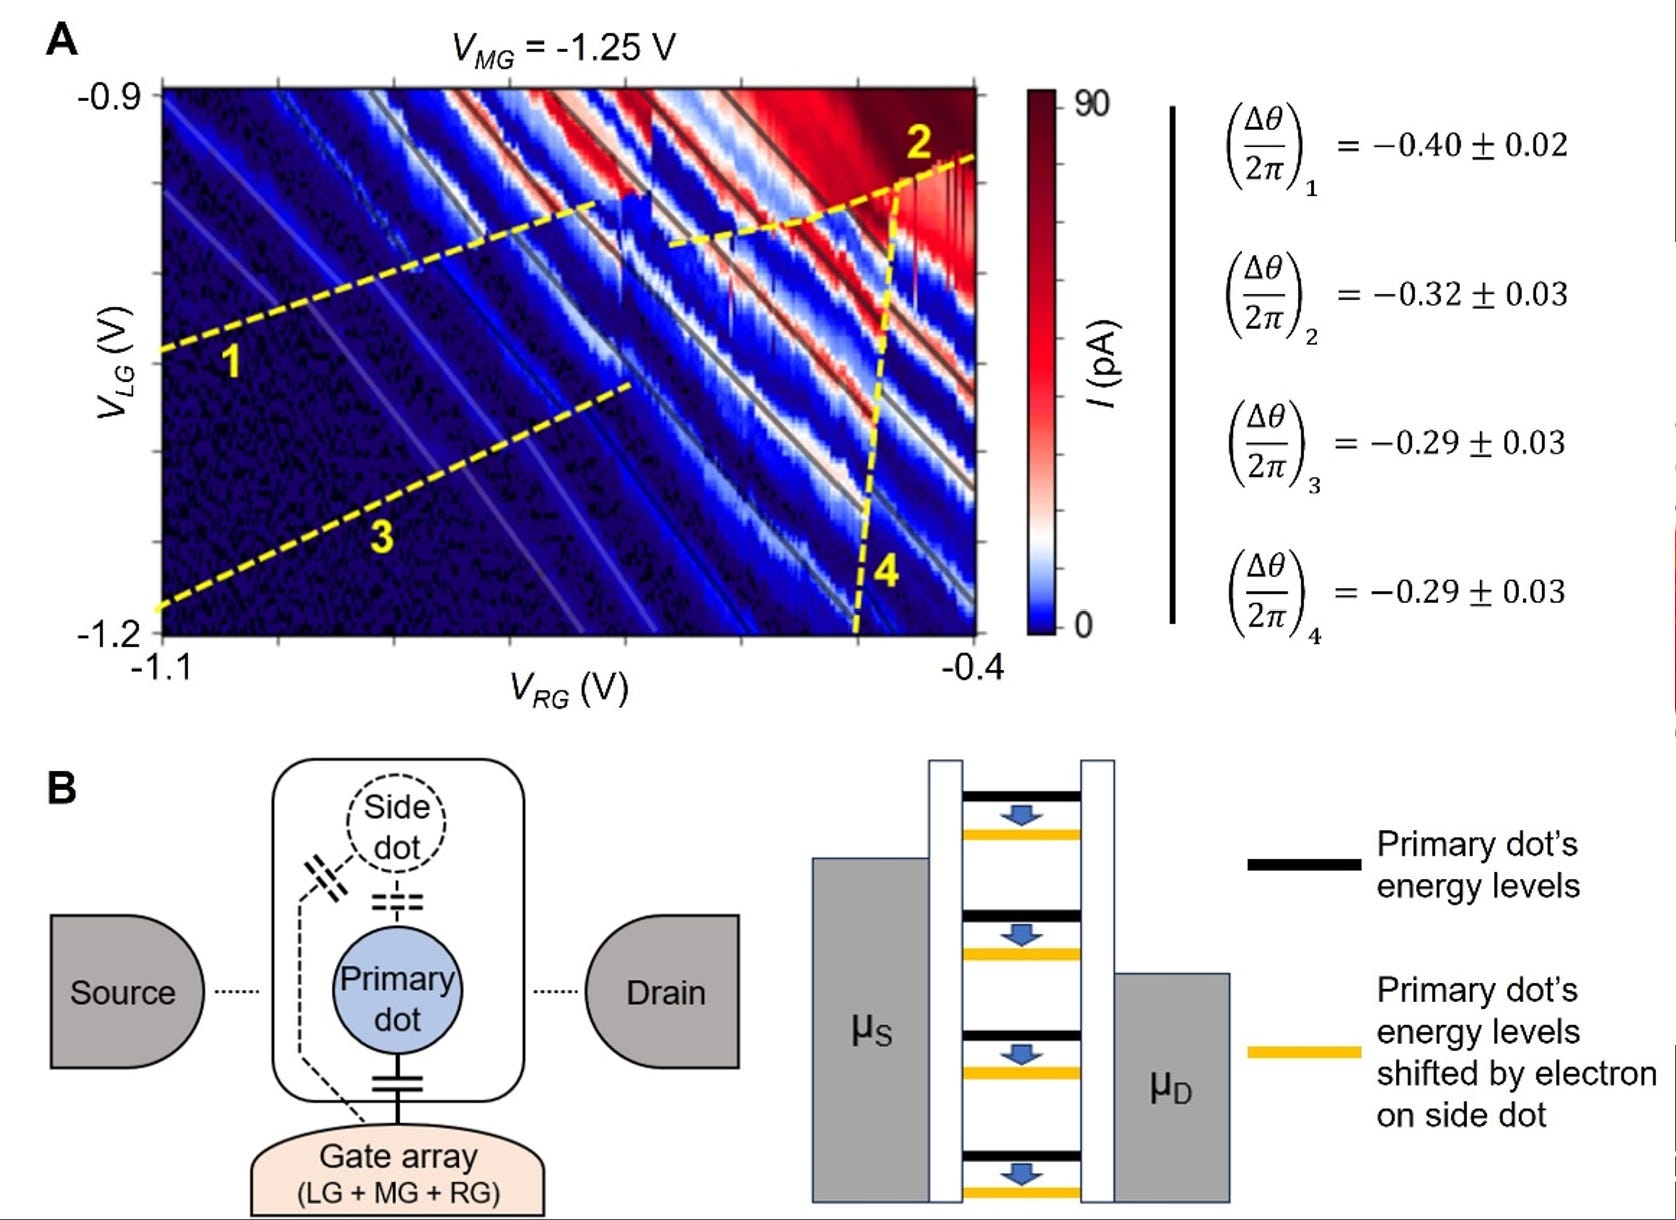
In our case, however, these shifts are nothing more than jumps of electrons, with their integer charges, in a nearby quantum dot. We did not create that second dot on purpose, it was accidental. The mutual capacitance between the intentional and the unintentional dots is such that an added charge in one results in a 1/3 shift in the other.
So, these are my four “smoking gun” examples. If you read our paper, you will find references to other works where smoking gun-looking signals with fairly mundane explanations were uncovered. Taken in isolation, each of these works, while important, is rather detailed and digs into a particular experiment it tries to emulate. The editors at glossy journals, which published the original claims eagerly, get bored and don’t want to pay attention to these follow-ups which are essentially negative reproduction studies. Though there are exceptions.
Taken together, we are using our collection of fine-tuned data to make a larger point. That in a modern scientific paper, which is nothing but a text with a few pictures, smoking gun evidence should be taken with great caution.
A critic would say (and they have!) that by asking for increased scrutiny we shut down creativity and prevent discoveries that start as mere speculations. But I for one am not against smoking gun papers. I admire true smoking guns. The problem arises when this becomes the expectation every for paper of significance. That it should contain a smoking gun proof. Then the literature becomes saturated, and you no longer know which of the many claims is the real smoking gun.
There is fortunately an easy fix - we can fill the illustrated essay paper with more substance by sharing more data, and code. These materials can be used to check for how fine-tuned and representative the data really are. Is what we are looking at in this figure a real correlation, or a coincidence? This should be possible to establish with enough evidence to analyze. My group shares full data from all experiments on Zenodo, a public data sharing platform run by CERN, and we have done so for this new paper. There you can make sure that we truly did do the finetuning, and we haven’t accidentally discovered triplet superconductivity, Majorana modes, their fusion, or fractional charges.